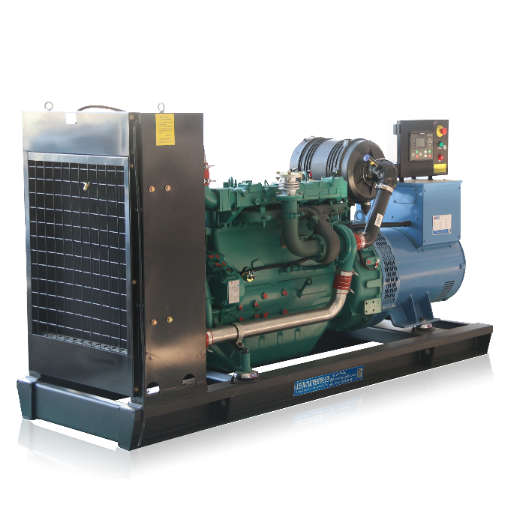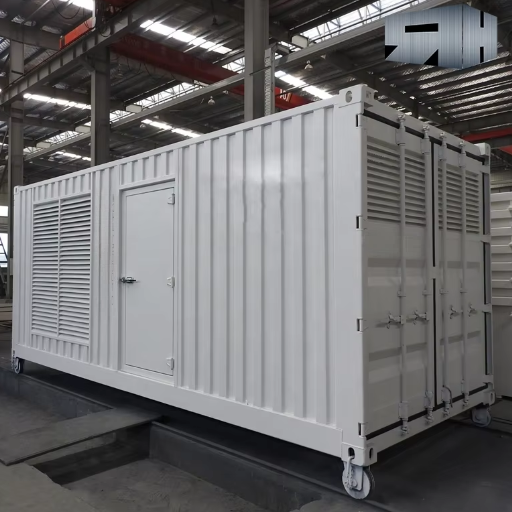
Generator Load Sharing: kW, kVAr and Unequal Ratings
Generator load sharing allocates real power (kW) and reactive power (kVAr) among machines connected to a common bus. With proportional sharing, each machine carries an agreed fraction of its configured rating. Different-size generators can therefore display different outputs at the same percentage load.
Both sets show the same frequency, yet their kW readings differ. Is that expected? You need the operating mode, rating bases and simultaneous readings to answer. Comparing those records helps you distinguish a sensible allocation from an unexplained deviation before accepting a parallel system.
The worked example below follows two unequal machines through their real and reactive allocations. It also gives project reviewers a practical evidence sheet to use alongside the wider generator paralleling specification.
Key Takeaways
- Review engine kW loading and alternator reactive loading separately.
- Compare each output with its agreed rating base.
- Identify deliberate asymmetric operation before judging unequal readings.
- Assess steady readings and load-change traces against project-specific criteria.
What Generator Load Sharing Controls After Closure
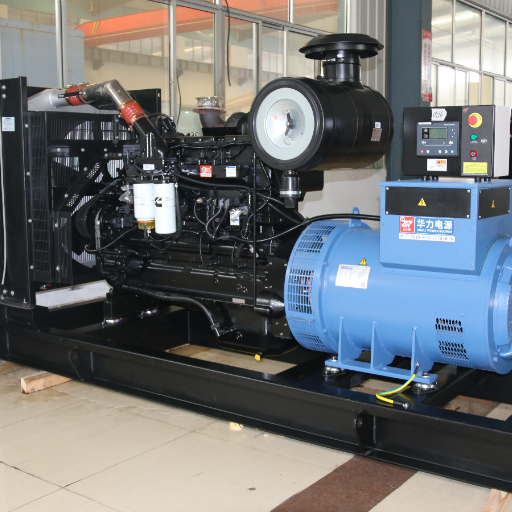
A common bus still permits different outputs
Once connected to the same bus, synchronized machines operate at the common electrical frequency. Their controls still have to divide the load. The useful measurements now include each set’s signed kW, signed kVAr, apparent power, phase currents and power factor.
A panel showing bus frequency gives you only part of that picture. Two generators can show matching frequency while one supplies a larger real-power share. Matching voltage alone also leaves the reactive allocation unresolved. Cummins explains these separate control tasks in sections 3.4.2 and 7.4.3.3 of its T-016 application manual, Issue 4, June 2014. Cummins paralleling application manual
Illustrative scenario A. A proposed installation pairs a 500 kW set with a 1,000 kW set. A reviewer receives two panel photographs with different kW readings. Before diagnosing imbalance, the reviewer needs to know whether the photographs represent the same instant, which machines were connected and which allocation mode was selected.
Establish the operating boundary
This example assumes an isolated generator bus. Utility-parallel operation needs its own control objectives and connection requirements. Start by identifying the intended bus arrangement and mode on the approved operating description.
Before closure, the project also needs to establish its generator synchronization requirements. Keep that check distinct from the post-close readings reviewed here.
For a proposal inquiry, send your project requirements with the generator ratings, load schedule and intended operating mode. State which sharing functions you want clarified.
How kW Sharing Follows Engine and Governor Control
Real power follows mechanical input
The engine supplies mechanical power to the alternator. The governor and engine controls change each connected machine’s real-power contribution. The machines still run at common electrical frequency. Interpret a speed-related command in that connected operating mode.
This explains why a frequency reading alone cannot tell you how hard each engine is working. Review measured kW together with its configured real-power base. Also check the selected duty rating and any site derating before interpreting a percentage on a display.
For an ideal proportional allocation, the expected real-power contribution of set i is given by the following relationship.
P_i = P_total × Pbase_i / sum(Pbase)
Here, P_total is the total real load allocated across the connected sets. Pbase_i is the agreed real-power sharing base for that set. The denominator includes the bases of the machines participating in that allocation. Controller-specific limits or deliberate asymmetric modes can change the expected result.
Work through the unequal-size example
Continue illustrative scenario A with a 900 kW total load. Assume both configured bases equal the stated 500 kW and 1,000 kW ratings, with no derating. The total base is 1,500 kW, so the common loading fraction is 900/1,500, or 60%.
The expected contributions are 300 kW and 600 kW. Both engines carry 60% of their respective bases. An equal 450 kW split would load the smaller set to 90% and the larger set to 45%. The arithmetic shows how misleading a simple comparison of absolute readings can be.
DEIF’s PPM 300 handbook uses the same proportional principle in its unequal-rating example in section 7.6.3. Its example uses different ratings from the hypothetical pair above. Section 7.6.4 separately describes asymmetric operation for that control system. DEIF PPM 300 designer’s handbook
Before querying a controller setting, request the configured bases, metering ratios and a simultaneous reading. A wrong current-transformer ratio or misunderstood display base should be investigated through the equipment records. The panel percentage becomes useful only when its denominator is clear.
How kVAr Sharing Follows Excitation and the AVR
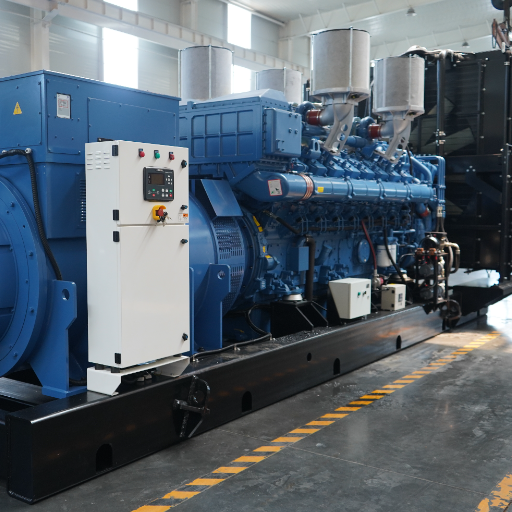
Review the reactive loop separately
Excitation and the automatic voltage regulator (AVR) govern the alternator’s reactive contribution. Recognized approaches include reactive droop, cross-current compensation and coordinated digital control. The selected equipment determines which scheme applies and which signals it needs.
Correct kW allocation leaves a separate question about kVAr. Request the reactive-sharing method, configured reactive base and sign convention. A positive or negative reading needs a documented meaning, especially when comparing instruments that label leading and lagging power factor differently.
The external manuals linked above support the separation between engine and excitation control. They also show why each loop needs review under the actual selected mode. A photograph of equal currents does not provide the signed real and reactive measurements needed to evaluate both allocations.
Apparent power exposes a hidden constraint
For balanced sinusoidal quantities, apparent power follows S = sqrt(P² + Q²), and power factor follows PF = P/S. Use consistent units, with P in kW, Q in kVAr and S in kVA. The site’s kVA to kW conversion guide explains the underlying quantities.
Illustrative scenario B
Assume the smaller machine is rated 625 kVA. At 300 kW and 600 kVAr, its calculated apparent power is about 671 kVA. Its real load is 60% of the assumed 500 kW engine base. Its apparent power exceeds the assumed alternator rating by about 46 kVA.
This calculation identifies a capacity concern in the illustration. Actual alternator assessment also needs the model’s capability limits, excitation conditions, phase currents and applicable site rating. A nameplate power triangle gives a reference point. The complete operating envelope requires the manufacturer’s data, including the relevant leading and lagging limits.
Where waveforms are distorted or phase loading is unequal, obtain suitable measurements and model-specific assessment. The simple balanced power triangle alone leaves those conditions unresolved. That distinction matters when a proposal includes nonlinear loads or a substantial single-phase load mix.
Match the test to the reactive question
A resistive load-bank run places little reactive demand on the system. STAMFORD’s AGN071, Issue C, explains that the quadrature-droop effect is negligible at unity power factor. Its discussion supports requesting a reactive test scope appropriate to the selected scheme. STAMFORD guidance on quadrature droop
Ask the project team to identify what the proposed test actually exercises. The selected load equipment, measurement channels and acceptance criteria should cover the reactive behavior being claimed. Manufacturer adjustment examples remain specific to their documented hardware and application.
Compare Unequal Ratings With a Defined Allocation Basis
Fix the assumptions before comparing percentages
Write down the applicable duty, site conditions and available capacity for each machine. Then identify the real and reactive bases used by the control system. A nameplate rating and a controller sharing base may differ. Document both so that a calculated percentage can be reproduced.
For the worked example, assume balanced sinusoidal loading, compatible configured controls and no site derating. Both sets have an assumed rated power factor of 0.8. The 500 kW machine is rated 625 kVA, and the 1,000 kW machine is rated 1,250 kVA.
The corresponding reactive reference values are 375 kVAr and 750 kVAr, calculated from the stated kW and kVA ratings. For the smaller unit, sqrt(625² - 500²) = 375 kVAr. The larger unit gives sqrt(1250² - 1000²) = 750 kVAr.
These calculated reference points use the assumed rated power factor. Obtain the actual reactive base and limits from the controller and alternator documents.
For proportional reactive allocation on these defined bases, use Q_i = Q_total × Qbase_i / sum(Qbase). Thus 675 × 375 / 1125 = 225 kVAr for the smaller set. The larger set supplies the remaining 450 kVAr. Keep the signed outputs and the selected sharing convention together on the calculation sheet.
Compare the complete P/Q allocation
Assume a total load of 900 kW and 675 kVAr. Proportional allocation on the stated bases gives the following results.
| Quantity | Smaller set | Larger set | Combined load or base |
|---|---|---|---|
| Assumed real-power base | 500 kW | 1,000 kW | 1,500 kW |
| Assumed apparent rating | 625 kVA | 1,250 kVA | 1,875 kVA |
| Illustrative reactive base | 375 kVAr | 750 kVAr | 1,125 kVAr |
| Allocated real output | 300 kW | 600 kW | 900 kW |
| Allocated reactive output | 225 kVAr | 450 kVAr | 675 kVAr |
| Calculated apparent output | 375 kVA | 750 kVA | 1,125 kVA |
| Output power factor | 0.8 | 0.8 | 0.8 |
Each real and reactive contribution is 60% of its assumed base. The calculated apparent outputs also reach 60% of the assumed ratings because both allocations follow the same proportion in this particular example.
Use the result to frame the next check
The smaller set’s 300 kW reading and the larger set’s 600 kW reading are consistent with the assumed proportional schedule. Change the operating mode, base or connected fleet, and you must calculate the expected allocation again. Preserve those assumptions beside the result.
Total available fleet capacity alone leaves the per-machine checks incomplete. Review engine limits, alternator capability and each phase’s current under the intended load mix. The three-phase generator sizing guide provides a separate route into phase-loading checks.
For a proposal comparison, put the supplier’s stated bases beside the expected kW and kVAr split. Ask how limits affect that split when a set approaches its permitted operating boundary. Record any unanswered points in the specification clarification list, with an owner and the supporting document requested.
Separate Proportional, Droop and Asymmetric Operating Modes
Read the control objective before judging the trend
Droop describes a control characteristic that relates frequency or voltage reference behavior to loading. Coordinated isochronous arrangements use compatible controls to maintain their frequency objective while dividing load. The approved scheme establishes how the real and reactive loops interact.
Ask which method is used for each loop. A governor-sharing connection says little about how the AVRs share reactive demand. Equipment drawings and controller documentation identify those functions. A familiar network socket shape alone cannot establish the protocol or supported sharing function behind it.
| Operating arrangement | Expected review focus | Evidence to request |
|---|---|---|
| Proportional isolated-bus sharing | Output relative to each configured base | Base table and simultaneous P/Q readings |
| Droop-based arrangement | Behavior against its approved characteristic | Mode description and applicable droop scheme |
| Coordinated isochronous arrangement | Frequency objective and allocation together | Compatible control architecture and trends |
| Intentional asymmetric allocation | Output against the selected schedule | Enabled mode, targets and limits |
| Utility-parallel operation | Approved import/export and reactive objectives | Connection requirements and selected control modes |
Recognize intentional unequal loading
Illustrative scenario C. Two equal-rated generators show different kW readings. Their project documents propose an asymmetric schedule. The reviewer asks for the enabled mode, target allocations and matching configuration revision before assessing whether the readings agree with that schedule.
That example leaves a concrete evidence question. Does the observed allocation follow the approved objective? A trend without the selected mode cannot answer it. A mode description without measured outputs leaves actual behavior equally uncertain.
For each trend, record the information needed to interpret its mode.
- Identify the enabled real-power and reactive-control functions.
- Attach the approved allocation targets and configuration revision.
- Mark whether the record shows a settled load point or a transition.
During an agreed unload ramp, the expected split may change with time. Compare the trace with the approved ramp description. Detailed load add/shed sequences, retrofit compatibility and communication-loss recovery each need their own project review beyond this allocation example.
Request Load-Sharing Evidence Before Acceptance
Build a per-set record
A useful record ties each measurement to equipment identity, mode and time. Ask for simultaneous traces with sufficient time resolution for the agreed event. Pair the trace with the configuration and drawing revisions used during the test.
| Record field | What the reviewer needs |
|---|---|
| Equipment identity | Generator, alternator, governor/controller and AVR models |
| Rating and bases | Applicable duty, site derating, configured P and Q bases |
| Operating state | Bus arrangement, connected sets, breaker states and selected mode |
| Per-set measurements | Signed kW and kVAr, kVA, phase currents, PF convention |
| Common measurements | Bus frequency, voltage and total load |
| Time and event | Shared time reference, load step or ramp, measurement interval |
| Acceptance record | Approved criteria, responsible reviewer, result and open issues |
For a steady-state point, compare each measured output with the expected allocation at that total load. Express any deviation on the agreed basis. A percentage of rated output and a percentage of allocated load describe different denominators. The report must identify which convention it uses.
For example, a 10 kW deviation on the hypothetical 500 kW base equals 2% of that base. This calculation supplies a reporting convention. The project’s approved tolerance determines whether that deviation is acceptable.
Keep settled performance and transitions distinct
Steady-state evidence describes the allocation after the agreed settling period. Transient evidence captures how the machines respond during a defined change. A settled snapshot cannot establish the peak excursion or recovery behavior during that event.
The competent project team should agree the test load, starting condition, permitted deviations, observation period and recovery criteria. It should also assign responsibility for test execution and review. Obtain those values from the selected equipment documentation and approved project requirements.
Include an agreed unload or transfer event where it belongs in the acceptance scope. Record the participating sets and the intended sequence so the reader can interpret the changing allocation. Detailed protection settings and switching instructions belong in the authorized commissioning documentation.
Close the evidence gaps explicitly
Return to illustrative scenario C. A trace, enabled-mode record and approved target schedule let the reviewer compare observed unequal output with the intended unequal allocation. If a required record is missing, identify the missing evidence and the person responsible for supplying it.
Use the same discipline for the smaller machine in scenario B. A plausible fleet kW total leaves its apparent-power concern open until per-set data and capability limits resolve it. Track each concern against its own acceptance criterion.
Retain the records with equipment identities and revision history in the factory acceptance dossier. For your generator load sharing inquiry, contact ZC Power with the rating table, controller and AVR models, load schedule and required modes. Identify the proposal or specification questions you need answered.
Generator Load Sharing FAQ
Should different-size generators show equal kW?
Under proportional operation, expected output follows each machine’s configured real-power base. A 500 kW set and a 1,000 kW set carrying a 900 kW total would supply 300 kW and 600 kW on the example’s assumptions. Confirm the selected mode and bases before comparing the readings.
Can kW share correctly while kVAr is uneven?
Yes. Real and reactive power have separate control tasks.
Engine/governor action governs the real contribution, while excitation and AVR behavior govern the reactive contribution. Review signed kVAr, apparent power, phase currents and power factor alongside kW. Each machine must remain within its applicable operating limits.
Why can matching frequency hide an imbalance?
Machines connected to the same bus operate at common electrical frequency. That shared value leaves their individual real-power contributions unresolved. Compare simultaneous per-set kW readings against configured bases and the approved allocation mode. For reactive allocation, obtain the separate kVAr measurements and excitation-scheme evidence as well.
Does a resistive load-bank test prove reactive sharing?
A resistive run alone leaves reactive-sharing performance unproven. At unity power factor, the quadrature-droop effect discussed in STAMFORD AGN071 is negligible. Request an agreed test scope that exercises the relevant reactive behavior, supported by signed measurements and equipment-specific criteria. A resistive report can still document its stated real-load test scope.
What sharing tolerance should I accept?
Use the selected equipment’s applicable requirements and the approved project criteria. Define the operating mode, load point, measurement basis and settling or recovery period with the tolerance. Record both steady-state and transient requirements where applicable. A generic percentage without those conditions leaves the acceptance decision ambiguous.